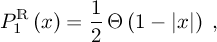
2.3. Distribution of the REAL Φ’s Eigenvalues
When analyzing the statistic of the NR REAL eigenvalues of
Φ, the very same concentration effect of Fig. (2)
has been found, so that the rescaling of eq. (6)
has to be taken in account here too. 
Figure 4: Histograms of Φ’s Eigenvalues This plot represents a bunch of 11 histograms of the REAL eigenvalues of rescaled superoperators Φ, distributed according to the measure induced by running the Hans-Jürgen procedure. The different colored lines represent the cases N=2 (two non-equal bumps − red line), N=3,4,5,6,7,8,10,12 and N=14 (light-blue line). Finally, we plotted in dark-blue the step function,
that we expect to represent the limiting distribution for very large N. |